If “tariff” isn’t the word of the year for stock investors so far, then perhaps it’s “uncertainty.” Uncertainty around trade policy dominated the path of the stock market in the first half and will continue to play a large role in the second half. Tariffs influence the key drivers of stock market performance: economic and corporate profit growth, inflation, and interest rates. If stocks continue to move higher in the second half of the year, trade policy will need to cooperate. Meanwhile, geopolitics remain a wildcard. Here we provide our midyear stock market outlook, taken from Midyear Outlook 2025: Pragmatic Optimism, Measured Expectations.
Historical Perspective
Using history as a guide, the unusually sharp and swift “V-shaped recovery” from the April 8 S&P 500 Index low was one of the most powerful post-correction rebounds in stock market history. The S&P 500 has rallied 15% or more in 28 trading days or less 11 other times since 1950, as it did from April 8 through mid-May. Subsequent 12-month returns for the index after these occurrences have averaged 26%, with all 11 periods producing positive returns, though past performance does not guarantee future results. But before you expect that much upside, consider most of these periods immediately followed recessions or significant growth scares — hardly the environment we are in today.
Stocks Tend to Keep Going Higher After Paring Corrections Losses
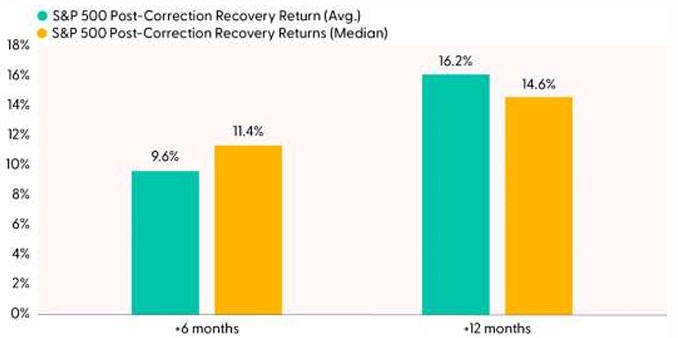
Source: LPL Research, Bloomberg, 07/10/25
All indexes are unmanaged and cannot be invested in directly. Past performance is no guarantee of future results.
Corrections (10–20% declines) that were fully recovered may be a better way to assess current market conditions, given a new high for the S&P 500 was reached on June 27, 2025. Once a correction loss has been fully recovered, double-digit gains over the next six months are a reasonable expectation, though past performance does not guarantee future results and the economy is not emerging from a significant growth scare that typically precedes the strongest rallies.
Earnings Outlook: The Two “Ts” Are the Keys
If stocks are going to go meaningfully higher from here in the second half of 2025, earnings will be an important part of the story. And you can’t talk about the earnings outlook without the two “T”s: tariffs and technology. Starting with tariffs, earnings growth in the first quarter for S&P 500 companies was solid at around 13%, with nearly half of that increase coming from big tech companies — the so-called Magnificent (Mag) Seven. Normally, investors would celebrate these numbers, but they were produced before most of the tariffs went into effect, which clouds the outlook.
Perhaps the biggest positive surprise last earnings season was 30%-plus earnings growth from the Mag Seven as a group. Every one of them maintained their capital expenditures (capex) guidance for the year — or in Meta’s (META) case, increased it. This capex — expected to exceed $340 billion this year — is a big potential driver of earnings growth and future productivity gains. This group continues to dominate the rest of the companies in the index (the remaining “493”).
As the economy likely slows in the second half and tariffs hit companies’ profit margins, the pace of earnings growth is poised to slow. While the latest consensus estimates for double-digit S&P 500 earnings gains may be credible in a blue-sky tariff scenario, they are too high for a tariff regime in the mid-teens, which is where we expect them to land (up from a less than 3% overall tariff rate on Inauguration Day). Tariffs could easily drag earnings down 2% or more, which informs our estimate range of $255 to $260 for S&P 500 earnings per share (EPS) in 2025 and roughly $275 — give or take a couple of dollars — in 2026. Risk of an oil price spike can’t be dismissed, but the Mideast conflict is unlikely to have much impact on corporate profits.
Big Tech Continues to Provide a Significant Earnings Boost
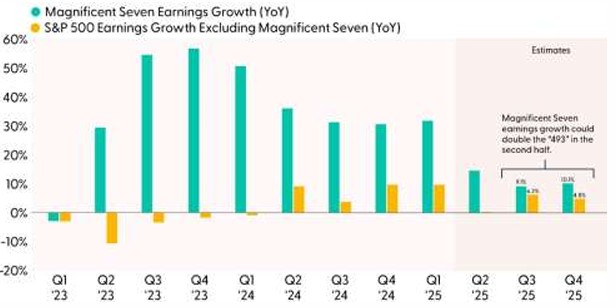
Source: LPL Research, Bloomberg, 06/27/25
All indexes are unmanaged and cannot be invested in directly. Estimates may not materialize as predicted and are subject to change.
Elevated Valuations Are Pricing in an Optimistic Outlook
Earnings will need to carry most of the load if stocks are going to achieve attractive second-half returns. The outlook for the economy and corporate profits remains clouded by tariff uncertainty, a potential uptick in inflation, and the risk of higher long-end yields. In that environment, LPL Research believes the opportunity for expansion of the S&P 500 price-to-earnings multiples (P/E) is limited. Recent valuations slightly below 22 times reflect a fair amount of optimism on trade policy given below-average earnings growth is likely this year and next. We forecast 6–7% earnings gains in 2025 and 2026 as price increases and corporate share buybacks help offset slower economic growth and tariff-related pressure on profit margins.
Stock Valuations Are Elevated, But Less So Excluding Mega-Cap Tech Stocks
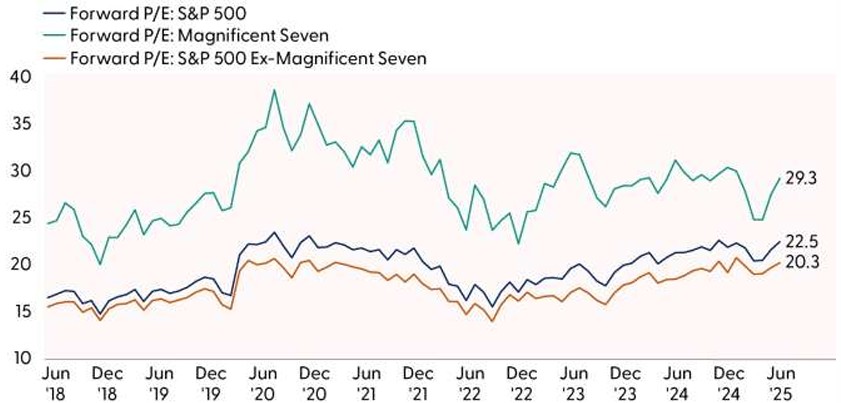
Source: LPL Research, Bloomberg, 07/10/25
All indexes are unmanaged and cannot be invested in directly. Estimates may not materialize as predicted and are subject to change
Valuing Stocks in an Uncertain Environment is No Easy Task
Trade policy uncertainty and the potential for more tariff-driven upward pressure on inflation and interest rates make the case for a higher P/E tough to make. But as long as tariff rates don’t go higher, we believe the S&P 500 can hold its current P/E near 22. LPL Research’s year-end 2025 fair value target range on the S&P 500 is 6,000 to 6,100, based on $275 in S&P 500 EPS in 2026. Importantly, fair value is just an assessment of what stocks might be worth at a given point in time. It is not a prediction that the index will trade at a particular price on that day. Stocks can trade above or below fair value for extended periods of time. That’s why investors should recognize that valuations are not good timing tools.
There are several paths to more upside. One is unanticipated productivity gains from AI investment. Another is the tax and spending bill that was just signed into law about a week ago (the so-called One Big Beautiful Bill Act), which could help lift corporate profits by stimulating capital investment. Generally, a more definitive pivot by the administration towards more pro-growth policies ahead of the midterm elections offers potential revenue upside for corporate America. Lower interest rates could also help lift valuations, though we’re not counting on that.
The numbers in the accompanying table illustrate a range of potential fair value S&P 500 targets based on what LPL Research believes are the most likely paths for the key drivers of earnings over the next 18 months and the potential economic and policy backdrop. A “blue-sky” bull case scenario could put the index potentially at 6,450 at year end, based on a P/E of 23 times and $280 in S&P 500 EPS for 2026. Rapid adoption of AI undoubtedly carries the potential to drive double-digit earnings growth in 2026.
Several recent developments have increased the chances the stock market achieves our bull case, as growing optimism surrounding AI, the surprising resilience of corporate America in the face of substantial tariff threats, and the Israel-Iran ceasefire have propelled the index over 6,200 and above LPL Research’s estimate of fair value. Key risks to monitor besides trade policy include stagflation and heightened geopolitical risk.
Year-End 2025 S&P 500 Fair Value Target Scenarios
Index Price Appreciation May Be Capped By Valuations
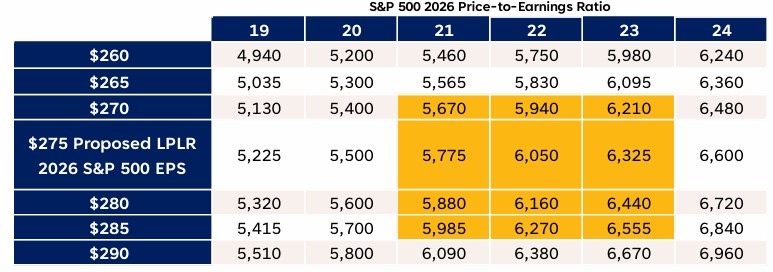
Source: LPL Research, Bloomberg, 07/10/25
Indexes are unmanaged and cannot be invested in directly. Estimates may not materialize as predicted.
Conclusion
As the second half of 2025 begins, earnings growth is slowing, tariffs are starting to bite, and geopolitical risk remains elevated. Yet, stock valuations reflect a lot of optimism. While trade uncertainty should start to dissipate in the second half, the path to clarity may be bumpy. Potential upside catalysts make us comfortable suggesting portfolio risk levels should be near benchmarks. Bottom line, anticipate modest gains for stocks over the next six months with volatility in between.
Asset Allocation Insights
LPL’s Strategic and Tactical Asset Allocation Committee (STAAC) maintains its tactical neutral stance on equities. Investors may be well served by bracing for occasional bouts of volatility until trade uncertainties are resolved. LPL Research advises against increasing portfolio risk beyond benchmark targets currently, as the market seems to be factoring in a lot of positive news. LPL Research continues to monitor tariff negotiations, economic data, earnings, the bond market, and various technical indicators to identify a potentially more attractive entry point to add equities on weakness.
During periods of policy uncertainty, LPL Research prefers to stray little from its benchmarks. In that spirit, the Committee recently upgraded emerging market (EM) equities to neutral, leaving regional preferences across the U.S, developed international, and EM aligned with benchmarks. The Committee still favors growth over value, large caps over small caps, and the communication services and financials sectors.
Within fixed income, the STAAC holds a neutral weight in core bonds, with a slight preference for mortgage-backed securities (MBS) over investment-grade corporates. The Committee believes the risk-reward for core bond sectors (U.S. Treasury, agency MBS, investment-grade corporates) is more attractive than plus sectors. The Committee does not believe adding duration (interest rate sensitivity) at current levels is attractive and remains neutral relative to benchmarks. The Committee would get more interested in adding long-term bonds if the U.S. 10-Year Treasury yield got closer to 5%.
Important Disclosures
This material is for general information only and is not intended to provide specific advice or recommendations for any individual. There is no assurance that the views or strategies discussed are suitable for all investors or will yield positive outcomes. Investing involves risks including possible loss of principal. Any economic forecasts set forth may not develop as predicted and are subject to change.
References to markets, asset classes, and sectors are generally regarding the corresponding market index. Indexes are unmanaged statistical composites and cannot be invested into directly. Index performance is not indicative of the performance of any investment and do not reflect fees, expenses, or sales charges. All performance referenced is historical and is no guarantee of future results.
Any company names noted herein are for educational purposes only and not an indication of trading intent or a solicitation of their products or services. LPL Financial doesn’t provide research on individual equities.
All information is believed to be from reliable sources; however, LPL Financial makes no representation as to its completeness or accuracy.
All investing involves risk, including possible loss of principal.
US Treasuries may be considered “safe haven” investments but do carry some degree of risk including interest rate, credit, and market risk. Bonds are subject to market and interest rate risk if sold prior to maturity. Bond values will decline as interest rates rise and bonds are subject to availability and change in price.
The Standard & Poor’s 500 Index (S&P500) is a capitalization-weighted index of 500 stocks designed to measure performance of the broad domestic economy through changes in the aggregate market value of 500 stocks representing all major industries.
The PE ratio (price-to-earnings ratio) is a measure of the price paid for a share relative to the annual net income or profit earned by the firm per share. It is a financial ratio used for valuation: a higher PE ratio means that investors are paying more for each unit of net income, so the stock is more expensive compared to one with lower PE ratio.
Earnings per share (EPS) is the portion of a company’s profit allocated to each outstanding share of common stock. EPS serves as an indicator of a company’s profitability. Earnings per share is generally considered to be the single most important variable in determining a share’s price. It is also a major component used to calculate the price-to-earnings valuation ratio.
All index data from FactSet or Bloomberg.
This research material has been prepared by LPL Financial LLC.
Not Insured by FDIC/NCUA or Any Other Government Agency | Not Bank/Credit Union Guaranteed | Not Bank/Credit Union Deposits or Obligations | May Lose Value
For public use.
Member FINRA/SIPC.
RES-0004766-0625 | Tracking #767181 | #767183 (Exp. 07/26)